B8. USE
1. The figure shows a graph of the function y=f(x) and a tangent to this graph, drawn at a point with the abscissa x0. Find the value of the derivative of the function f(x) at the point x0. Answer: 2
2.

Answer: -5
3.
On the interval (–9; 4).

Answer: 2
4.

Find the value of the derivative of the function f(x) at the point x0 Answer: 0.5
5. Find the point of contact between the line y = 3x + 8 and the graph of the function y = x3+x2-5x-4. Indicate the abscissa of this point in your answer. Answer: -2
6.

Determine the number of integer values of the argument for which the derivative of the function f(x) is negative. Answer: 4
7.

Answer: 2
8.

Find the number of points where the tangent to the graph of the function f(x) is parallel to or coincides with the line y=5–x. Answer: 3
9.
Interval (-8; 3).

Direct y = -20. Answer: 2
10.

Answer: -0.5
11

Answer: 1
12. The figure shows the graph of the function y=f(x) and the tangent to it at the point with the abscissa x0.

Find the value of the derivative of the function f(x) at the point x0. Answer: 0.5
13. The figure shows the graph of the function y=f(x) and the tangent to it at the point with the abscissa x0.

Find the value of the derivative of the function f(x) at the point x0. Answer: -0.25
14.

Find the number of points where the tangent to the graph of the function f(x) is parallel to or coincides with the line y = x+7. Answer: 4
15

Find the value of the derivative of the function f(x) at the point x0. Answer: -2
16.
interval (-14;9).

Find the number of maximum points of the function f(x) on the interval [-12;7]. Answer: 3
17
on the interval (-10; 8).

Find the number of extremum points of the function f(x) on the interval [-9;7]. Answer: 4
18. The line y = 5x-7 touches the graph of the function y = 6x2 + bx-1 at a point with an abscissa less than 0. Find b. Answer: 17
19

Answer:-0,25
20
 Answer: 6
21. Find the tangent to the graph of the function y=x2+6x-7, parallel to the line y=5x+11. In your answer, indicate the abscissa of the point of contact. Answer: -0,5
22.
 Answer: 4
23. f "(x) on the interval (-16; 4).

On the segment [-11; 0] find the number of maximum points of the function. Answer: 1
B8 Graphs of functions, derivatives of functions. Function research . USE
1.
The figure shows a graph of the function y=f(x) and a tangent to this graph, drawn at a point with the abscissa x0. Find the value of the derivative of the function f(x) at the point x0.
2. The figure shows a graph of the derivative of the function f(x) defined on the interval (-6; 5).

At what point of the segment [-5; -1] f(x) takes the smallest value?
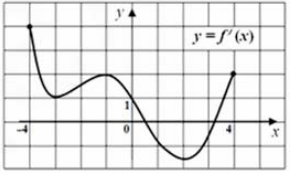
3. The figure shows a graph of the derivative of the function y = f(x), defined
On the interval (–9; 4).
Find the number of points where the tangent to the graph of the function f(x) is parallel to the line
y = 2x-17 or the same.
4. The figure shows the graph of the function y = f(x) and the tangent to it at the point with the abscissa x0.
Find the value of the derivative of the function f(x) at the point x0
5. Find the point of contact between the line y = 3x + 8 and the graph of the function y = x3+x2-5x-4. Indicate the abscissa of this point in your answer.
6. The figure shows a graph of the function y = f(x), defined on the interval (-7; 5).

Determine the number of integer values of the argument for which the derivative of the function f(x) is negative.
7. The figure shows a graph of the function y \u003d f "(x), defined on the interval (-8; 8).

Find the number of extremum points of the function f(x) belonging to the interval [-4; 6].
8. The figure shows a graph of the function y \u003d f "(x), defined on the interval (-8; 4).

Find the number of points where the tangent to the graph of the function f(x) is parallel to or coincides with the line y=5–x.
9. The figure shows a graph of the derivative of the function y = f(x) defined on
Interval (-8; 3).
Find the number of points where the tangent to the graph of a function is parallel
Direct y = -20.
10. The figure shows the graph of the function y=f(x) and the tangent to it at the point with the abscissa x0.
Find the value of the derivative of the function f(x) at the point x0.
11 . The figure shows a graph of the derivative of the function f (x), defined on the interval (-9; 9).
Find the number of minimum points of the function $f(x)$ on the segment [-6;8]. 1
12. The figure shows the graph of the function y=f(x) and the tangent to it at the point with the abscissa x0.

Find the value of the derivative of the function f(x) at the point x0.
13. The figure shows the graph of the function y=f(x) and the tangent to it at the point with the abscissa x0.
Find the value of the derivative of the function f(x) at the point x0.
14. The figure shows a graph of the derivative of the function f (x), defined on the interval (-6; 8).
Find the number of points where the tangent to the graph of the function f(x) is parallel to or coincides with the line y = x+7.
15 . The figure shows the graph of the function y = f(x) and the tangent to it at the point with the abscissa x0.
Find the value of the derivative of the function f(x) at the point x0.
16. The figure shows a graph of the derivative of the function f(x) defined on
interval (-14;9).
Find the number of maximum points of the function f(x) on the interval [-12;7].
17 . The figure shows a graph of the derivative of the function f(x) defined
on the interval (-10; 8).
Find the number of extremum points of the function f(x) on the interval [-9;7].
18. The line y = 5x-7 touches the graph of the function y = 6x2 + bx-1 at a point with an abscissa less than 0. Find b.
19 . The figure shows the graph of the derivative of the function f(x) and the tangent to it at the point with the abscissa x0.

Find the value of the derivative of the function f(x) at the point x0.
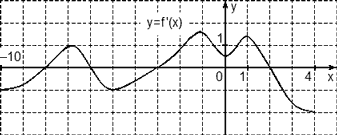
20 . Find the number of points in the interval (-1;12) where the derivative of the function y = f(x) shown on the graph is equal to 0.

21. Find the tangent to the graph of the function y=x2+6x-7, parallel to the line y=5x+11. In your answer, indicate the abscissa of the point of contact.
22. The figure shows the graph of the function y=f(x). Find the number of integer points in the interval (-2;11) where the derivative of the function f(x) is positive.

23. The figure shows the graph of the function y= f "(x) on the interval (-16; 4).

On the segment [-11; 0] find the number of maximum points of the function.
The figure shows a graph of the derivative of the function f(x) defined on the interval [–5; 6]. Find the number of points of the graph f (x), in each of which the tangent drawn to the graph of the function coincides or is parallel to the x-axis
The figure shows a graph of the derivative of a differentiable function y = f(x).
Find the number of points in the graph of the function that belong to the segment [–7; 7], in which the tangent to the graph of the function is parallel to the straight line given by the equation y = –3x.

Material point M starts moving from point A and moves in a straight line for 12 seconds. The graph shows how the distance from point A to point M changed over time. The abscissa shows the time t in seconds, the ordinate shows the distance s in meters. Determine how many times during the movement the speed of point M went to zero (ignore the beginning and end of the movement).

The figure shows sections of the graph of the function y \u003d f (x) and the tangent to it at the point with the abscissa x \u003d 0. It is known that this tangent is parallel to the straight line passing through the points of the graph with the abscissas x \u003d -2 and x \u003d 3. Using this, find the value of the derivative f "(o).

The figure shows a graph y = f'(x) - the derivative of the function f(x), defined on the segment (−11; 2). Find the abscissa of the point at which the tangent to the graph of the function y = f(x) is parallel to the x-axis or coincides with it.

The material point moves rectilinearly according to the law x(t)=(1/3)t^3-3t^2-5t+3, where x is the distance from the reference point in meters, t is the time in seconds measured from the beginning of the movement. At what point in time (in seconds) was her speed equal to 2 m/s?
The material point moves along a straight line from the initial to the final position. The figure shows a graph of its movement. Time in seconds is plotted on the abscissa axis, distance from the initial position of the point (in meters) is plotted on the ordinate axis. Find the average speed of the point. Give your answer in meters per second.

The function y \u003d f (x) is defined on the interval [-4; four]. The figure shows a graph of its derivative. Find the number of points in the graph of the function y \u003d f (x), the tangent in which forms an angle of 45 ° with the positive direction of the Ox axis.
The function y \u003d f (x) is defined on the segment [-2; four]. The figure shows a graph of its derivative. Find the abscissa of the point of the graph of the function y \u003d f (x), in which it takes the smallest value on the segment [-2; -0.001].

The figure shows the graph of the function y \u003d f (x) and the tangent to this graph, drawn at the point x0. The tangent is given by the equation y = -2x + 15. Find the value of the derivative of the function y = -(1/4)f(x) + 5 at the point x0.

Seven points are marked on the graph of the differentiable function y = f(x): x1,..,x7. Find all marked points where the derivative of the function f(x) is greater than zero. Enter the number of these points in your answer.

The figure shows the graph y \u003d f "(x) of the derivative of the function f (x), defined on the interval (-10; 2). Find the number of points at which the tangent to the graph of the function f (x) is parallel to the line y \u003d -2x-11 or matches it.

The figure shows a graph of y \u003d f "(x) - the derivative of the function f (x). Nine points are marked on the x-axis: x1, x2, x3, x4, x5, x6, x6, x7, x8, x9.
How many of these points belong to the intervals of decreasing function f(x) ?

The figure shows the graph of the function y \u003d f (x) and the tangent to this graph, drawn at the point x0. The tangent is given by the equation y = 1.5x + 3.5. Find the value of the derivative of the function y \u003d 2f (x) - 1 at the point x0.

The figure shows a graph y=F(x) of one of the antiderivatives of the function f (x). Six points with abscissas x1, x2, ..., x6 are marked on the graph. At how many of these points does the function y=f(x) take negative values?

The figure shows the schedule of the car along the route. Time is plotted on the abscissa axis (in hours), on the ordinate axis - the distance traveled (in kilometers). Find the average speed of the car on this route. Give your answer in km/h

The material point moves rectilinearly according to the law x(t)=(-1/6)t^3+7t^2+6t+1, where x is the distance from the reference point (in meters), t is the time of movement (in seconds). Find its speed (in meters per second) at time t=6 s
The figure shows a graph of the antiderivative y \u003d F (x) of some function y \u003d f (x), defined on the interval (-6; 7). Using the figure, determine the number of zeros of the function f(x) in a given interval.

The figure shows a graph y = F(x) of one of the antiderivatives of some function f(x) defined on the interval (-7; 5). Using the figure, determine the number of solutions to the equation f(x) = 0 on the segment [- 5; 2].

The figure shows a graph of a differentiable function y=f(x). Nine points are marked on the x-axis: x1, x2, ... x9. Find all marked points where the derivative of f(x) is negative. Enter the number of these points in your answer.

The material point moves rectilinearly according to the law x(t)=12t^3−3t^2+2t, where x is the distance from the reference point in meters, t is the time in seconds measured from the beginning of the movement. Find its speed (in meters per second) at time t=6 s.
The figure shows the graph of the function y=f(x) and the tangent to this graph drawn at the point x0. The tangent equation is shown in the figure. find the value of the derivative of the function y=4*f(x)-3 at the point x0.
In problem B9, a graph of a function or derivative is given, from which it is required to determine one of the following quantities:
- The value of the derivative at some point x 0,
- High or low points (extremum points),
- Intervals of increasing and decreasing functions (intervals of monotonicity).
The functions and derivatives presented in this problem are always continuous, which greatly simplifies the solution. Despite the fact that the task belongs to the section of mathematical analysis, it is quite within the power of even the weakest students, since no deep theoretical knowledge is required here.
To find the value of the derivative, extremum points and monotonicity intervals, there are simple and universal algorithms - all of them will be discussed below.
Read the condition of problem B9 carefully so as not to make stupid mistakes: sometimes quite voluminous texts come across, but there are few important conditions that affect the course of the solution.
Calculation of the value of the derivative. Two point method
If the problem is given a graph of the function f(x), tangent to this graph at some point x 0 , and it is required to find the value of the derivative at this point, the following algorithm is applied:
- Find two "adequate" points on the tangent graph: their coordinates must be integer. Let's denote these points as A (x 1 ; y 1) and B (x 2 ; y 2). Write down the coordinates correctly - this is the key point of the solution, and any mistake here leads to the wrong answer.
- Knowing the coordinates, it is easy to calculate the increment of the argument Δx = x 2 − x 1 and the increment of the function Δy = y 2 − y 1 .
- Finally, we find the value of the derivative D = Δy/Δx. In other words, you need to divide the function increment by the argument increment - and this will be the answer.
Once again, we note: points A and B must be sought precisely on the tangent, and not on the graph of the function f(x), as is often the case. The tangent will necessarily contain at least two such points, otherwise the problem is formulated incorrectly.
Consider the points A (−3; 2) and B (−1; 6) and find the increments:
Δx \u003d x 2 - x 1 \u003d -1 - (-3) \u003d 2; Δy \u003d y 2 - y 1 \u003d 6 - 2 \u003d 4.
Let's find the value of the derivative: D = Δy/Δx = 4/2 = 2.
A task. The figure shows the graph of the function y \u003d f (x) and the tangent to it at the point with the abscissa x 0. Find the value of the derivative of the function f(x) at the point x 0 .

Consider points A (0; 3) and B (3; 0), find increments:
Δx \u003d x 2 - x 1 \u003d 3 - 0 \u003d 3; Δy \u003d y 2 - y 1 \u003d 0 - 3 \u003d -3.
Now we find the value of the derivative: D = Δy/Δx = −3/3 = −1.
A task. The figure shows the graph of the function y \u003d f (x) and the tangent to it at the point with the abscissa x 0. Find the value of the derivative of the function f(x) at the point x 0 .

Consider points A (0; 2) and B (5; 2) and find increments:
Δx \u003d x 2 - x 1 \u003d 5 - 0 \u003d 5; Δy = y 2 - y 1 = 2 - 2 = 0.
It remains to find the value of the derivative: D = Δy/Δx = 0/5 = 0.
From the last example, we can formulate the rule: if the tangent is parallel to the OX axis, the derivative of the function at the point of contact is equal to zero. In this case, you don’t even need to calculate anything - just look at the graph.
Calculating High and Low Points
Sometimes instead of a graph of a function in problem B9, a derivative graph is given and it is required to find the maximum or minimum point of the function. In this scenario, the two-point method is useless, but there is another, even simpler algorithm. First, let's define the terminology:
- The point x 0 is called the maximum point of the function f(x) if the following inequality holds in some neighborhood of this point: f(x 0) ≥ f(x).
- The point x 0 is called the minimum point of the function f(x) if the following inequality holds in some neighborhood of this point: f(x 0) ≤ f(x).
In order to find the maximum and minimum points on the graph of the derivative, it is enough to perform the following steps:
- Redraw the graph of the derivative, removing all unnecessary information. As practice shows, extra data only interfere with the solution. Therefore, we mark the zeros of the derivative on the coordinate axis - and that's it.
- Find out the signs of the derivative on the intervals between zeros. If for some point x 0 it is known that f'(x 0) ≠ 0, then only two options are possible: f'(x 0) ≥ 0 or f'(x 0) ≤ 0. The sign of the derivative is easy to determine from the original drawing: if the derivative graph lies above the OX axis, then f'(x) ≥ 0. Conversely, if the derivative graph lies below the OX axis, then f'(x) ≤ 0.
- We again check the zeros and signs of the derivative. Where the sign changes from minus to plus, there is a minimum point. Conversely, if the sign of the derivative changes from plus to minus, this is the maximum point. Counting is always done from left to right.
This scheme works only for continuous functions - there are no others in problem B9.
A task. The figure shows a graph of the derivative of the function f(x) defined on the interval [−5; 5]. Find the minimum point of the function f(x) on this segment.

Let's get rid of unnecessary information - we will leave only the borders [−5; 5] and the zeros of the derivative x = −3 and x = 2.5. Also note the signs:
Obviously, at the point x = −3, the sign of the derivative changes from minus to plus. This is the minimum point.
A task. The figure shows a graph of the derivative of the function f(x) defined on the interval [−3; 7]. Find the maximum point of the function f(x) on this segment.

Let's redraw the graph, leaving only the boundaries [−3; 7] and the zeros of the derivative x = −1.7 and x = 5. Note the signs of the derivative on the resulting graph. We have:
![]()
Obviously, at the point x = 5, the sign of the derivative changes from plus to minus - this is the maximum point.
A task. The figure shows a graph of the derivative of the function f(x) defined on the segment [−6; four]. Find the number of maximum points of the function f(x) that belong to the interval [−4; 3].

It follows from the conditions of the problem that it is sufficient to consider only the part of the graph bounded by the segment [−4; 3]. Therefore, we build a new graph, on which we mark only the boundaries [−4; 3] and the zeros of the derivative inside it. Namely, the points x = −3.5 and x = 2. We get:
![]()
On this graph, there is only one maximum point x = 2. It is in it that the sign of the derivative changes from plus to minus.
A small note about points with non-integer coordinates. For example, in the last problem, the point x = −3.5 was considered, but with the same success we can take x = −3.4. If the problem is formulated correctly, such changes should not affect the answer, since the points "without a fixed place of residence" are not directly involved in solving the problem. Of course, with integer points such a trick will not work.
Finding intervals of increase and decrease of a function
In such a problem, like the points of maximum and minimum, it is proposed to find areas in which the function itself increases or decreases from the graph of the derivative. First, let's define what ascending and descending are:
- A function f(x) is called increasing on a segment if for any two points x 1 and x 2 from this segment the statement is true: x 1 ≤ x 2 ⇒ f(x 1) ≤ f(x 2). In other words, the larger the value of the argument, the larger the value of the function.
- A function f(x) is called decreasing on a segment if for any two points x 1 and x 2 from this segment the statement is true: x 1 ≤ x 2 ⇒ f(x 1) ≥ f(x 2). Those. a larger value of the argument corresponds to a smaller value of the function.
We formulate sufficient conditions for increasing and decreasing:
- For a continuous function f(x) to increase on the segment , it is sufficient that its derivative inside the segment be positive, i.e. f'(x) ≥ 0.
- For a continuous function f(x) to decrease on the segment , it is sufficient that its derivative inside the segment be negative, i.e. f'(x) ≤ 0.
We accept these assertions without proof. Thus, we get a scheme for finding intervals of increase and decrease, which is in many ways similar to the algorithm for calculating extremum points:
- Remove all redundant information. On the original graph of the derivative, we are primarily interested in the zeros of the function, so we leave only them.
- Mark the signs of the derivative at the intervals between zeros. Where f'(x) ≥ 0, the function increases, and where f'(x) ≤ 0, it decreases. If the problem has restrictions on the variable x, we additionally mark them on the new chart.
- Now that we know the behavior of the function and the constraint, it remains to calculate the required value in the problem.
A task. The figure shows a graph of the derivative of the function f(x) defined on the segment [−3; 7.5]. Find the intervals of decreasing function f(x). In your answer, write the sum of integers included in these intervals.

As usual, we redraw the graph and mark the boundaries [−3; 7.5], as well as the zeros of the derivative x = −1.5 and x = 5.3. Then we mark the signs of the derivative. We have:
![]()
Since the derivative is negative on the interval (− 1.5), this is the interval of decreasing function. It remains to sum all the integers that are inside this interval:
−1 + 0 + 1 + 2 + 3 + 4 + 5 = 14.
A task. The figure shows a graph of the derivative of the function f(x) defined on the segment [−10; four]. Find the intervals of increasing function f(x). In your answer, write the length of the largest of them.
Let's get rid of redundant information. We leave only the boundaries [−10; 4] and zeros of the derivative, which this time turned out to be four: x = −8, x = −6, x = −3 and x = 2. Note the signs of the derivative and get the following picture:
We are interested in the intervals of increasing function, i.e. where f'(x) ≥ 0. There are two such intervals on the graph: (−8; −6) and (−3; 2). Let's calculate their lengths:
l 1 = − 6 − (−8) = 2;
l 2 = 2 − (−3) = 5.
Since it is required to find the length of the largest of the intervals, we write the value l 2 = 5 in response.
The line y=3x+2 is tangent to the graph of the function y=-12x^2+bx-10. Find b , given that the abscissa of the touch point is less than zero.
Show SolutionSolution
Let x_0 be the abscissa of the point on the graph of the function y=-12x^2+bx-10 through which the tangent to this graph passes.
The value of the derivative at the point x_0 is equal to the slope of the tangent, i.e. y"(x_0)=-24x_0+b=3. On the other hand, the tangent point belongs to both the graph of the function and the tangent, i.e. -12x_0^2+bx_0-10= 3x_0 + 2. We get a system of equations \begin(cases) -24x_0+b=3,\\-12x_0^2+bx_0-10=3x_0+2. \end(cases)
Solving this system, we get x_0^2=1, which means either x_0=-1 or x_0=1. According to the condition of the abscissa, the touch points are less than zero, therefore x_0=-1, then b=3+24x_0=-21.
Answer
Condition
The figure shows a graph of the function y=f(x) (which is a broken line made up of three straight line segments). Using the figure, compute F(9)-F(5), where F(x) is one of the antiderivatives of f(x).
Show SolutionSolution
According to the Newton-Leibniz formula, the difference F(9)-F(5), where F(x) is one of the antiderivatives of the function f(x), is equal to the area of the curvilinear trapezoid bounded by the graph of the function y=f(x), straight lines y=0 , x=9 and x=5. According to the graph, we determine that the specified curvilinear trapezoid is a trapezoid with bases equal to 4 and 3 and a height of 3.
Its area is equal to \frac(4+3)(2)\cdot 3=10.5.
Answer
Source: "Mathematics. Preparation for the exam-2017. profile level. Ed. F. F. Lysenko, S. Yu. Kulabukhova.
Condition
The figure shows a graph of y \u003d f "(x) - the derivative of the function f (x), defined on the interval (-4; 10). Find the intervals of decreasing function f (x). In your answer, indicate the length of the largest of them.

Solution
As you know, the function f (x) decreases on those intervals, at each point of which the derivative f "(x) is less than zero. Considering that it is necessary to find the length of the largest of them, three such intervals are naturally distinguished from the figure: (-4; -2) ;(0;3);(5;9).
The length of the largest of them - (5; 9) is equal to 4.
Answer
Source: "Mathematics. Preparation for the exam-2017. profile level. Ed. F. F. Lysenko, S. Yu. Kulabukhova.
Condition
The figure shows a graph of y \u003d f "(x) - the derivative of the function f (x), defined on the interval (-8; 7). Find the number of maximum points of the function f (x) belonging to the interval [-6; -2].
.png)
Solution
The graph shows that the derivative f "(x) of the function f (x) changes sign from plus to minus (there will be a maximum at such points) at exactly one point (between -5 and -4) from the interval [-6; -2 Therefore, there is exactly one maximum point on the interval [-6;-2].
Answer
Source: "Mathematics. Preparation for the exam-2017. profile level. Ed. F. F. Lysenko, S. Yu. Kulabukhova.
Condition
The figure shows a graph of the function y=f(x) defined on the interval (-2; 8). Determine the number of points where the derivative of the function f(x) is equal to 0 .

Solution
If the derivative at a point is equal to zero, then the tangent to the graph of the function drawn at this point is parallel to the Ox axis. Therefore, we find such points at which the tangent to the function graph is parallel to the Ox axis. On this chart, such points are extremum points (maximum or minimum points). As you can see, there are 5 extremum points.
Answer
Source: "Mathematics. Preparation for the exam-2017. profile level. Ed. F. F. Lysenko, S. Yu. Kulabukhova.
Condition
The line y=-3x+4 is parallel to the tangent to the graph of the function y=-x^2+5x-7. Find the abscissa of the point of contact.
Show SolutionSolution
The slope of the line to the graph of the function y=-x^2+5x-7 at an arbitrary point x_0 is y"(x_0). But y"=-2x+5, so y"(x_0)=-2x_0+5. Angular the coefficient of the line y=-3x+4 specified in the condition is -3.Parallel lines have the same slopes.Therefore, we find such a value x_0 that =-2x_0 +5=-3.
We get: x_0 = 4.
Answer
Source: "Mathematics. Preparation for the exam-2017. profile level. Ed. F. F. Lysenko, S. Yu. Kulabukhova.
Condition
The figure shows a graph of the function y=f(x) and marked points -6, -1, 1, 4 on the x-axis. At which of these points is the value of the derivative the smallest? Please indicate this point in your answer.
