We choose a rectangular coordinate system on the plane and plot the values of the argument on the abscissa axis X, and on the y-axis - the values of the function y = f(x).
Function Graph y = f(x) the set of all points is called, for which the abscissas belong to the domain of the function, and the ordinates are equal to the corresponding values of the function.
In other words, the graph of the function y \u003d f (x) is the set of all points in the plane, the coordinates X, at which satisfy the relation y = f(x).

On fig. 45 and 46 are graphs of functions y = 2x + 1 And y \u003d x 2 - 2x.
Strictly speaking, one should distinguish between the graph of a function (the exact mathematical definition of which was given above) and the drawn curve, which always gives only a more or less accurate sketch of the graph (and even then, as a rule, not the entire graph, but only its part located in the final parts of the plane). In what follows, however, we will usually refer to "chart" rather than "chart sketch".
Using a graph, you can find the value of a function at a point. Namely, if the point x = a belongs to the scope of the function y = f(x), then to find the number f(a)(i.e. the function values at the point x = a) should do so. Need through a dot with an abscissa x = a draw a straight line parallel to the y-axis; this line will intersect the graph of the function y = f(x) at one point; the ordinate of this point will be, by virtue of the definition of the graph, equal to f(a)(Fig. 47).

For example, for the function f(x) = x 2 - 2x using the graph (Fig. 46) we find f(-1) = 3, f(0) = 0, f(1) = -l, f(2) = 0, etc.
A function graph visually illustrates the behavior and properties of a function. For example, from a consideration of Fig. 46 it is clear that the function y \u003d x 2 - 2x takes positive values when X< 0 and at x > 2, negative - at 0< x < 2; наименьшее значение функция y \u003d x 2 - 2x accepts at x = 1.
To plot a function f(x) you need to find all points of the plane, coordinates X,at which satisfy the equation y = f(x). In most cases, this is impossible, since there are infinitely many such points. Therefore, the graph of the function is depicted approximately - with greater or lesser accuracy. The simplest is the multi-point plotting method. It consists in the fact that the argument X give a finite number of values - say, x 1 , x 2 , x 3 ,..., x k and make a table that includes the selected values of the function.
The table looks like this:
Having compiled such a table, we can outline several points on the graph of the function y = f(x). Then, connecting these points with a smooth line, we get an approximate view of the graph of the function y = f(x).
However, it should be noted that the multi-point plotting method is very unreliable. In fact, the behavior of the graph between the marked points and its behavior outside the segment between the extreme points taken remains unknown.
Example 1. To plot a function y = f(x) someone compiled a table of argument and function values:
The corresponding five points are shown in Fig. 48.

Based on the location of these points, he concluded that the graph of the function is a straight line (shown in Fig. 48 by a dotted line). Can this conclusion be considered reliable? Unless there are additional considerations to support this conclusion, it can hardly be considered reliable. reliable.
To substantiate our assertion, consider the function
![]() .
.
Calculations show that the values of this function at points -2, -1, 0, 1, 2 are just described by the above table. However, the graph of this function is not at all a straight line (it is shown in Fig. 49). Another example is the function y = x + l + sinx; its meanings are also described in the table above.

These examples show that in its "pure" form, the multi-point plotting method is unreliable. Therefore, to plot a given function, as a rule, proceed as follows. First, the properties of this function are studied, with the help of which it is possible to construct a sketch of the graph. Then, by calculating the values of the function at several points (the choice of which depends on the set properties of the function), the corresponding points of the graph are found. And finally, a curve is drawn through the constructed points using the properties of this function.
We will consider some (the most simple and frequently used) properties of functions used to find a sketch of a graph later, and now we will analyze some commonly used methods for plotting graphs.
Graph of the function y = |f(x)|.
It is often necessary to plot a function y = |f(x)|, where f(x) - given function. Recall how this is done. By definition of the absolute value of a number, one can write
![]()
This means that the graph of the function y=|f(x)| can be obtained from the graph, functions y = f(x) as follows: all points of the graph of the function y = f(x), whose ordinates are non-negative, should be left unchanged; further, instead of the points of the graph of the function y = f(x), having negative coordinates, one should construct the corresponding points of the graph of the function y = -f(x)(i.e. part of the function graph
y = f(x), which lies below the axis X, should be reflected symmetrically about the axis X).

Example 2 Plot a function y = |x|.
We take the graph of the function y = x(Fig. 50, a) and part of this graph with X< 0 (lying under the axis X) is symmetrically reflected about the axis X. As a result, we get the graph of the function y = |x|(Fig. 50, b).
Example 3. Plot a function y = |x 2 - 2x|.

First we plot the function y = x 2 - 2x. The graph of this function is a parabola, the branches of which are directed upwards, the top of the parabola has coordinates (1; -1), its graph intersects the abscissa axis at points 0 and 2. On the interval (0; 2) the function takes negative values, therefore this part of the graph reflect symmetrically about the x-axis. Figure 51 shows a graph of the function y \u003d |x 2 -2x |, based on the graph of the function y = x 2 - 2x
Graph of the function y = f(x) + g(x)
Consider the problem of plotting the function y = f(x) + g(x). if graphs of functions are given y = f(x) And y = g(x).
Note that the domain of the function y = |f(x) + g(х)| is the set of all those values of x for which both functions y = f(x) and y = g(x) are defined, i.e. this domain of definition is the intersection of the domains of definition, the functions f(x) and g(x).
Let the points (x 0, y 1) And (x 0, y 2) respectively belong to the function graphs y = f(x) And y = g(x), i.e. y 1 \u003d f (x 0), y 2 \u003d g (x 0). Then the point (x0;. y1 + y2) belongs to the graph of the function y = f(x) + g(x)(for f(x 0) + g(x 0) = y 1+y2),. and any point of the graph of the function y = f(x) + g(x) can be obtained in this way. Therefore, the graph of the function y = f(x) + g(x) can be obtained from function graphs y = f(x). And y = g(x) by replacing each point ( x n, y 1) function graphics y = f(x) dot (x n, y 1 + y 2), Where y 2 = g(x n), i.e., by shifting each point ( x n, y 1) function graph y = f(x) along the axis at by the amount y 1 \u003d g (x n). In this case, only such points are considered. X n for which both functions are defined y = f(x) And y = g(x).
This method of plotting a function graph y = f(x) + g(x) is called the addition of graphs of functions y = f(x) And y = g(x)
Example 4. In the figure, by the method of adding graphs, a graph of the function is constructed
y = x + sinx.
When plotting a function y = x + sinx we assumed that f(x) = x, A g(x) = sinx. To build a function graph, we select points with abscissas -1.5π, -, -0.5, 0, 0.5,, 1.5, 2. Values f(x) = x, g(x) = sinx, y = x + sinx we will calculate at the selected points and place the results in the table.
Build a function
We bring to your attention a service for plotting function graphs online, all rights to which belong to the company Desmos. Use the left column to enter functions. You can enter manually or using the virtual keyboard at the bottom of the window. To enlarge the chart window, you can hide both the left column and the virtual keyboard.
Benefits of online charting
- Visual display of introduced functions
- Building very complex graphs
- Plotting implicitly defined graphs (e.g. ellipse x^2/9+y^2/16=1)
- The ability to save charts and get a link to them, which becomes available to everyone on the Internet
- Scale control, line color
- The ability to plot graphs by points, the use of constants
- Construction of several graphs of functions at the same time
- Plotting in polar coordinates (use r and θ(\theta))
With us it is easy to build graphs of varying complexity online. The construction is done instantly. The service is in demand for finding intersection points of functions, for displaying graphs for their further transfer to a Word document as illustrations for solving problems, for analyzing the behavioral features of function graphs. The best browser for working with charts on this page of the site is Google Chrome. When using other browsers, correct operation is not guaranteed.
One of the most famous exponential functions in mathematics is the exponent. It is the Euler number raised to the specified power. In Excel, there is a separate operator that allows you to calculate it. Let's see how it can be used in practice.
The exponent is the Euler number raised to a given power. The Euler number itself is approximately 2.718281828. Sometimes it is also called the Napier number. The exponent function looks like this:
where e is the Euler number and n is the exponent.
To calculate this indicator in Excel, a separate operator is used - EXP. In addition, this function can be displayed as a graph. We will talk about working with these tools further.
Method 1: calculating the exponent by manually entering a function
EXP(number)
That is, this formula contains only one argument. It just represents the degree to which you need to raise the Euler number. This argument can be either in the form of a numeric value or take the form of a reference to a cell containing a degree indicator.


Method 2: Using the Function Wizard
Although the syntax for calculating the exponent is extremely simple, some users prefer to use Function Wizard. Let's see how this is done with an example.


If a reference to a cell that contains an exponent is used as an argument, then you need to put the cursor in the field "Number" and just select that cell on the sheet. Its coordinates will immediately be displayed in the field. After that, to calculate the result, click on the button OK.

Method 3: plotting a graph
In addition, in Excel there is an opportunity to build a graph based on the results obtained as a result of calculating the exponent. To build a graph on the sheet, there must already be calculated values of the exponent of various degrees. You can calculate them using one of the methods described above.
The length of the segment on the coordinate axis is found by the formula:
The length of the segment on the coordinate plane is sought by the formula:
To find the length of a segment in a three-dimensional coordinate system, the following formula is used:
The coordinates of the middle of the segment (for the coordinate axis only the first formula is used, for the coordinate plane - the first two formulas, for the three-dimensional coordinate system - all three formulas) are calculated by the formulas:
Function is a correspondence of the form y= f(x) between variables, due to which each considered value of some variable x(argument or independent variable) corresponds to a certain value of another variable, y(dependent variable, sometimes this value is simply called the value of the function). Note that the function assumes that one value of the argument X there can only be one value of the dependent variable at. However, the same value at can be obtained with various X.
Function scope are all values of the independent variable (function argument, usually X) for which the function is defined, i.e. its meaning exists. The domain of definition is indicated D(y). By and large, you are already familiar with this concept. The scope of a function is otherwise called the domain of valid values, or ODZ, which you have been able to find for a long time.
Function range are all possible values of the dependent variable of this function. Denoted E(at).
Function rises on the interval on which the larger value of the argument corresponds to the larger value of the function. Function Decreasing on the interval on which the larger value of the argument corresponds to the smaller value of the function.
Function intervals are the intervals of the independent variable at which the dependent variable retains its positive or negative sign.
Function zeros are those values of the argument for which the value of the function is equal to zero. At these points, the graph of the function intersects the abscissa axis (OX axis). Very often, the need to find the zeros of a function means simply solving the equation. Also, often the need to find intervals of constant sign means the need to simply solve the inequality.
Function y = f(x) are called even X
![]()
This means that for any opposite values of the argument, the values of the even function are equal. The graph of an even function is always symmetrical about the y-axis of the op-amp.
Function y = f(x) are called odd, if it is defined on a symmetric set and for any X from the domain of definition the equality is fulfilled:
![]()
This means that for any opposite values of the argument, the values of the odd function are also opposite. The graph of an odd function is always symmetrical about the origin.
The sum of the roots of even and odd functions (points of intersection of the abscissa axis OX) is always equal to zero, because for every positive root X has a negative root X.
It is important to note that some function does not have to be even or odd. There are many functions that are neither even nor odd. Such functions are called general functions, and none of the above equalities or properties hold for them.
Linear function is called a function that can be given by the formula:
The graph of a linear function is a straight line and in the general case looks like this (an example is given for the case when k> 0, in this case the function is increasing; for the occasion k < 0 функция будет убывающей, т.е. прямая будет наклонена в другую сторону - слева направо):

Graph of Quadratic Function (Parabola)
The graph of a parabola is given by a quadratic function:
A quadratic function, like any other function, intersects the OX axis at the points that are its roots: ( x 1 ; 0) and ( x 2; 0). If there are no roots, then the quadratic function does not intersect the OX axis, if there is one root, then at this point ( x 0; 0) the quadratic function only touches the OX axis, but does not intersect it. A quadratic function always intersects the OY axis at a point with coordinates: (0; c). The graph of a quadratic function (parabola) may look like this (the figure shows examples that far from exhaust all possible types of parabolas):

Wherein:
- if the coefficient a> 0, in the function y = ax 2 + bx + c, then the branches of the parabola are directed upwards;
- if a < 0, то ветви параболы направлены вниз.
Parabola vertex coordinates can be calculated using the following formulas. X tops (p- in the figures above) of a parabola (or the point at which the square trinomial reaches its maximum or minimum value):
Y tops (q- in the figures above) of a parabola or the maximum if the branches of the parabola are directed downwards ( a < 0), либо минимальное, если ветви параболы направлены вверх (a> 0), the value of the square trinomial:
Graphs of other functions
power function
Here are some examples of graphs of power functions:

Inversely proportional dependence call the function given by the formula:
Depending on the sign of the number k An inversely proportional graph can have two fundamental options:

Asymptote is the line to which the line of the graph of the function approaches infinitely close, but does not intersect. The asymptotes for the inverse proportionality graphs shown in the figure above are the coordinate axes, to which the graph of the function approaches infinitely close, but does not intersect them.
exponential function with base A call the function given by the formula:
a the graph of an exponential function can have two fundamental options (we will also give examples, see below):

logarithmic function call the function given by the formula:
Depending on whether the number is greater or less than one a The graph of a logarithmic function can have two fundamental options:

Function Graph y = |x| as follows:

Graphs of periodic (trigonometric) functions
Function at = f(x) is called periodical, if there exists such a non-zero number T, What f(x + T) = f(x), for anyone X out of function scope f(x). If the function f(x) is periodic with period T, then the function:
Where: A, k, b are constant numbers, and k not equal to zero, also periodic with a period T 1 , which is determined by the formula:
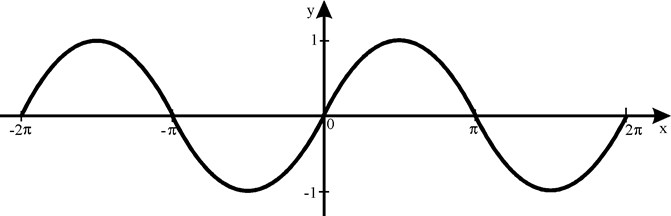
Most examples of periodic functions are trigonometric functions. Here are the graphs of the main trigonometric functions. The following figure shows part of the graph of the function y= sin x(the whole graph continues indefinitely to the left and right), the graph of the function y= sin x called sinusoid:
Function Graph y= cos x called cosine wave. This graph is shown in the following figure. Since the graph of the sine, it continues indefinitely along the OX axis to the left and to the right:

Function Graph y=tg x called tangentoid. This graph is shown in the following figure. Like the graphs of other periodic functions, this graph repeats indefinitely along the OX axis to the left and to the right.

And finally, the graph of the function y=ctg x called cotangentoid. This graph is shown in the following figure. Like the graphs of other periodic and trigonometric functions, this graph repeats indefinitely along the OX axis to the left and to the right.

- Back
- Forward
How to successfully prepare for the CT in Physics and Mathematics?
In order to successfully prepare for the CT in Physics and Mathematics, among other things, three critical conditions must be met:
- Study all the topics and complete all the tests and tasks given in the study materials on this site. To do this, you need nothing at all, namely: to devote three to four hours every day to preparing for the CT in physics and mathematics, studying theory and solving problems. The fact is that the DT is an exam where it is not enough just to know physics or mathematics, you also need to be able to quickly and without failures solve a large number of problems on various topics and varying complexity. The latter can only be learned by solving thousands of problems.
- Learn all formulas and laws in physics, and formulas and methods in mathematics. In fact, it is also very simple to do this, there are only about 200 necessary formulas in physics, and even a little less in mathematics. In each of these subjects there are about a dozen standard methods for solving problems of a basic level of complexity, which can also be learned, and thus, completely automatically and without difficulty, solve most of the digital transformation at the right time. After that, you will only have to think about the most difficult tasks.
- Attend all three stages of rehearsal testing in physics and mathematics. Each RT can be visited twice to solve both options. Again, on the CT, in addition to the ability to quickly and efficiently solve problems, and the knowledge of formulas and methods, it is also necessary to be able to properly plan time, distribute forces, and most importantly fill out the answer form correctly, without confusing either the numbers of answers and tasks, or your own name. Also, during the RT, it is important to get used to the style of posing questions in tasks, which may seem very unusual to an unprepared person on the DT.
Successful, diligent and responsible fulfillment of these three points, as well as responsible study of the final training tests, will allow you to show an excellent result on the CT, the maximum of what you are capable of.
Found an error?
If you, as it seems to you, have found an error in the training materials, then please write about it by e-mail (). In the letter, indicate the subject (physics or mathematics), the name or number of the topic or test, the number of the task, or the place in the text (page) where, in your opinion, there is an error. Also describe what the alleged error is. Your letter will not go unnoticed, the error will either be corrected, or you will be explained why it is not a mistake.
First, try to find the scope of the function:
Did you manage? Let's compare the answers:
All right? Well done!
Now let's try to find the range of the function:

Found? Compare:
Did it agree? Well done!
Let's work with the graphs again, only now it's a little more difficult - to find both the domain of the function and the range of the function.
How to Find Both the Domain and Range of a Function (Advanced)

Here's what happened:
With graphics, I think you figured it out. Now let's try to find the domain of the function in accordance with the formulas (if you don't know how to do this, read the section about):
Did you manage? Checking answers:
- , since the root expression must be greater than or equal to zero.
- , since it is impossible to divide by zero and the radical expression cannot be negative.
- , since, respectively, for all.
- because you can't divide by zero.
However, we still have one more moment that has not been sorted out ...
Let me reiterate the definition and focus on it:
Noticed? The word "only" is a very, very important element of our definition. I will try to explain to you on the fingers.
Let's say we have a function given by a straight line. . When, we substitute this value into our "rule" and get that. One value corresponds to one value. We can even make a table of various values and plot a given function to verify this.
"Look! - you say, - "" meets twice!" So maybe the parabola is not a function? No, it is!
The fact that "" occurs twice is far from a reason to accuse the parabola of ambiguity!
The fact is that, when calculating for, we got one game. And when calculating with, we got one game. So that's right, the parabola is a function. Look at the chart:

Got it? If not, here's a real-life example for you, far from mathematics!
Let's say we have a group of applicants who met when submitting documents, each of whom told in a conversation where he lives:

Agree, it is quite realistic that several guys live in the same city, but it is impossible for one person to live in several cities at the same time. This is, as it were, a logical representation of our "parabola" - Several different x's correspond to the same y.
Now let's come up with an example where the dependency is not a function. Let's say these same guys told what specialties they applied for:

Here we have a completely different situation: one person can easily apply for one or several directions. That is one element sets are put in correspondence multiple elements sets. Respectively, it's not a function.
Let's test your knowledge in practice.
Determine from the pictures what is a function and what is not:

Got it? And here is answers:
- The function is - B,E.
- Not a function - A, B, D, D.
You ask why? Yes, here's why:

In all figures except IN) And E) there are several for one!
I am sure that now you can easily distinguish a function from a non-function, say what an argument is and what a dependent variable is, and also determine the scope of the argument and the scope of the function. Let's move on to the next section - how to define a function?
Ways to set a function
What do you think the words mean "set function"? That's right, it means explaining to everyone what function we are talking about in this case. Moreover, explain in such a way that everyone understands you correctly and the graphs of functions drawn by people according to your explanation were the same.
How can I do that? How to set a function? The easiest way, which has already been used more than once in this article - using a formula. We write a formula, and by substituting a value into it, we calculate the value. And as you remember, a formula is a law, a rule according to which it becomes clear to us and to another person how an X turns into a Y.
Usually, this is exactly what they do - in tasks we see ready-made functions defined by formulas, however, there are other ways to set a function that everyone forgets about, and therefore the question “how else can you set a function?” confuses. Let's take a look at everything in order, and start with the analytical method.
Analytical way of defining a function
The analytical method is the task of a function using a formula. This is the most universal and comprehensive and unambiguous way. If you have a formula, then you know absolutely everything about the function - you can make a table of values on it, you can build a graph, determine where the function increases and where it decreases, in general, explore it in full.
Let's consider a function. What does it matter?
"What does it mean?" - you ask. I'll explain now.
Let me remind you that in the notation, the expression in brackets is called the argument. And this argument can be any expression, not necessarily simple. Accordingly, whatever the argument (expression in brackets), we will write it instead in the expression.
In our example, it will look like this:
Consider another task related to the analytical method of specifying a function that you will have on the exam.
Find the value of the expression, at.
I'm sure that at first, you were scared when you saw such an expression, but there is absolutely nothing scary in it!
Everything is the same as in the previous example: whatever the argument (expression in brackets), we will write it instead in the expression. For example, for a function.
What should be done in our example? Instead, you need to write, and instead of -:
shorten the resulting expression:
That's all!
Independent work
Now try to find the meaning of the following expressions yourself:
- , If
- , If
Did you manage? Let's compare our answers: We are used to the fact that the function has the form
Even in our examples, we define the function in this way, but analytically it is possible to define the function implicitly, for example.
Try building this function yourself.
Did you manage?
Here's how I built it.
What equation did we end up with?
Right! Linear, which means that the graph will be a straight line. Let's make a table to determine which points belong to our line:
That's just what we were talking about ... One corresponds to several.
Let's try to draw what happened:

Is what we got a function?
That's right, no! Why? Try to answer this question with a picture. What did you get?

“Because one value corresponds to several values!”
What conclusion can we draw from this?
That's right, a function can't always be expressed explicitly, and what's "disguised" as a function isn't always a function!
Tabular way of defining a function
As the name suggests, this method is a simple plate. Yes Yes. Like the one we already made. For example:
Here you immediately noticed a pattern - Y is three times larger than X. And now the “think very well” task: do you think that a function given in the form of a table is equivalent to a function?
Let's not talk for a long time, but let's draw!
So. We draw a function given in both ways:

Do you see the difference? It's not about the marked points! Take a closer look:

Have you seen it now? When we set the function in a tabular way, we reflect on the graph only those points that we have in the table and the line (as in our case) passes only through them. When we define a function in an analytical way, we can take any points, and our function is not limited to them. Here is such a feature. Remember!
Graphical way to build a function
The graphical way of constructing a function is no less convenient. We draw our function, and another interested person can find what y is equal to at a certain x, and so on. Graphical and analytical methods are among the most common.
However, here you need to remember what we talked about at the very beginning - not every “squiggle” drawn in the coordinate system is a function! Remembered? Just in case, I'll copy here the definition of what a function is:
As a rule, people usually name exactly those three ways of specifying a function that we have analyzed - analytical (using a formula), tabular and graphic, completely forgetting that a function can be described verbally. Like this? Yes, very easy!
Verbal description of the function
How to describe the function verbally? Let's take our recent example - . This function can be described as "each real value of x corresponds to its triple value." That's all. Nothing complicated. Of course, you will object - “there are such complex functions that it is simply impossible to set verbally!” Yes, there are some, but there are functions that are easier to describe verbally than to set with a formula. For example: "each natural value of x corresponds to the difference between the digits of which it consists, while the largest digit contained in the number entry is taken as the minuend." Now consider how our verbal description of the function is implemented in practice:
The largest digit in a given number -, respectively, - is reduced, then:
Main types of functions
Now let's move on to the most interesting - we will consider the main types of functions with which you worked / work and will work in the course of school and institute mathematics, that is, we will get to know them, so to speak, and give them a brief description. Read more about each function in the corresponding section.
Linear function
A function of the form, where, are real numbers.
The graph of this function is a straight line, so the construction of a linear function is reduced to finding the coordinates of two points.
The position of the straight line on the coordinate plane depends on the slope.

Function scope (aka argument range) - .
The range of values is .
quadratic function
Function of the form, where
The graph of the function is a parabola, when the branches of the parabola are directed downwards, when - upwards.
Many properties of a quadratic function depend on the value of the discriminant. The discriminant is calculated by the formula
The position of the parabola on the coordinate plane relative to the value and coefficient is shown in the figure:

Domain
The range of values depends on the extremum of the given function (the vertex of the parabola) and the coefficient (the direction of the branches of the parabola)
Inverse proportionality
The function given by the formula, where
The number is called the inverse proportionality factor. Depending on what value, the branches of the hyperbola are in different squares:

Domain - .
The range of values is .
SUMMARY AND BASIC FORMULA
1. A function is a rule according to which each element of a set is assigned a unique element of the set.
- - this is a formula denoting a function, that is, the dependence of one variable on another;
- - variable, or argument;
- - dependent value - changes when the argument changes, that is, according to some specific formula that reflects the dependence of one value on another.
2. Valid argument values, or the scope of a function, is what is related to the possible under which the function makes sense.
3. Range of function values- this is what values it takes, with valid values.
4. There are 4 ways to set the function:
- analytical (using formulas);
- tabular;
- graphic
- verbal description.
5. Main types of functions:
- : , where, are real numbers;
- : , Where;
- : , Where.
